
Official websites use .gov
A .gov website belongs to an official government
organization in the United States.
Secure .gov websites use HTTPS
A lock (
) or https:// means you’ve safely connected to
the .gov website. Share sensitive information only on official,
secure websites.
GSL releases big update to weather forecast tool
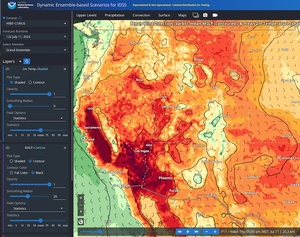
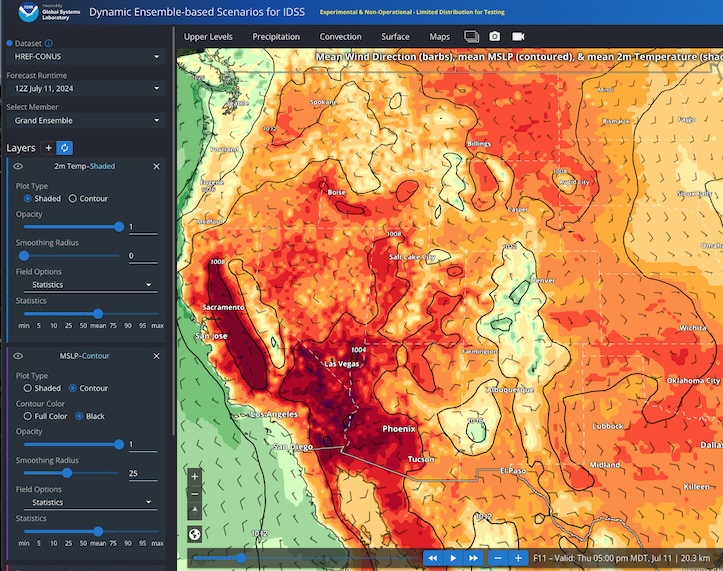 NOAA GSL has released a new version of the Dynamic Ensemble-based Scenarios for Impact-based Decision Support (DESI), a powerful tool for ensemble-based weather forecast information and visualization. DESI 3.1 builds on the additions from version 3.0 to give NOAA National Weather Service (NWS) meteorologists the tools to better serve their communities and give the best weather information to those who need it. The image to the right shows the forecast heat today in the west reaching 118 degrees Fahrenheit in southern California.
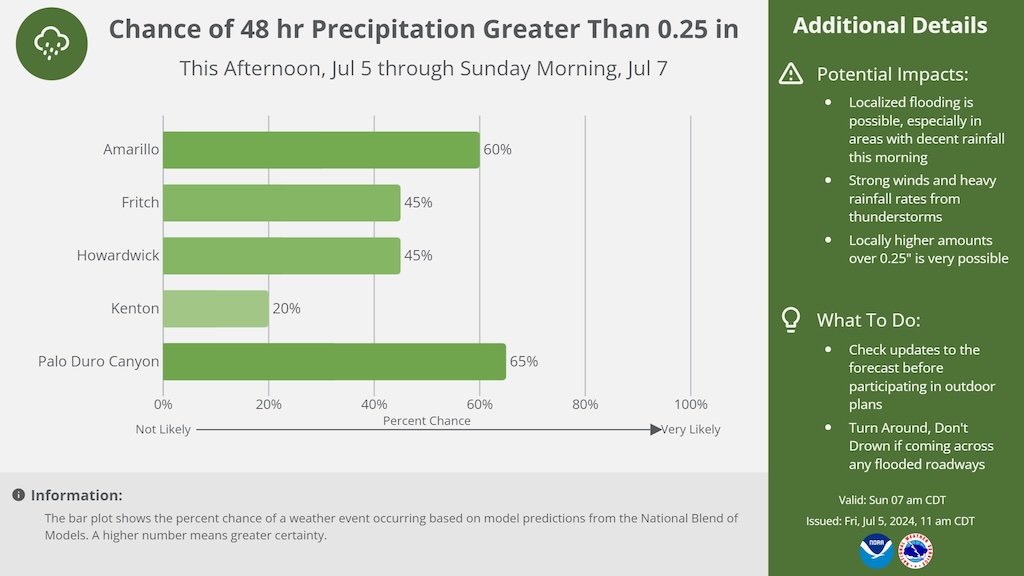
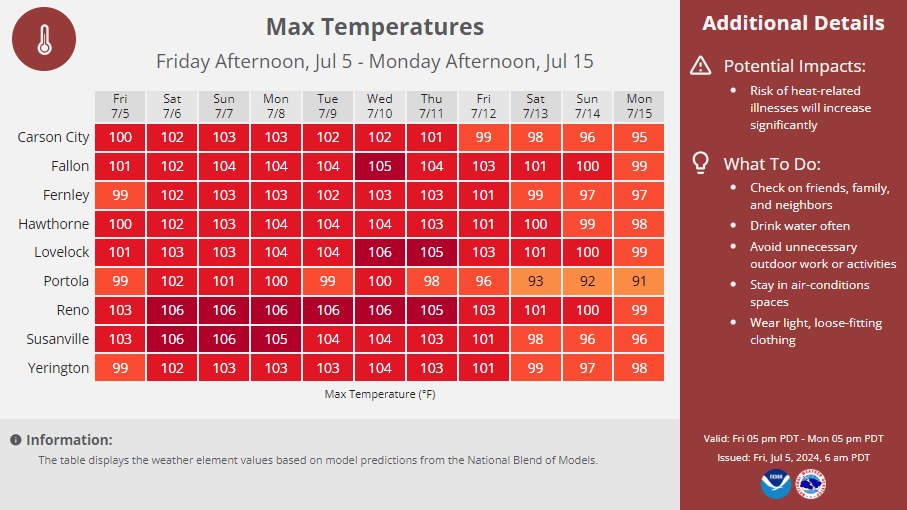
One of the most important new features in DESI 3.1 now allows for point-based graphics to be created within the software. Graphic templates include bar charts, line charts, and tables, and are fully customizable for forecasters to include specific information or calls to action. The point-based graphics interact with the “favorites” list in the location database to make the process faster and simpler for communicating forecasts. Through this addition, NWS meteorologists will be able to expand their communications on their websites and social media.
DESI 3.1 now offers dynamic resolution. This process reduces the resolution of the models when zoomed out and allows forecasters to assess information over
the full domain of the model. When the user then zooms into a local area, the resolution automatically increases until the native model resolution is reached. With dynamic resolution, forecasters will now be able to easily change the areas they wish to look at through their forecasting process.
Another feature is the “locations” database interface. The database includes thousands of cities across the United States and allows offices to create “favorites” lists of cities they often use in their graphics. In addition, offices can manually input locations that their office may need for special events, such as during wildfires and other decision support service events
Finally, DESI 3.1 includes a variety of other new features, including but not limited to 3D terrain display, new High-Resolution Ensemble Forecast (HREF) fields, updated color tables for colorblind accessibility, smoothing capability, and a variety of new sounding features. This fall, DESI 3.2 will expand on its graphics capabilities for stakeholders among other new features.
Kudos to the DESI team for this accomplishment!
Travis Wilson
Rob Howlett
Jebb Stewart
Phil Schumacher
Cole Vaughn
Jacob Radford
Korri Anderson (NWS)
Mike Rehnberg (NWS)