Official websites use .gov
A .gov website belongs to an official government
organization in the United States.
Secure .gov websites use HTTPS
A lock (
) or https:// means you’ve safely connected to
the .gov website. Share sensitive information only on official,
secure websites.
History
Over the decades, the Global Systems Laboratory (GSL) has evolved from its initial foundation as PROFS to becoming a cornerstone of NOAA Research at the forefront of meteorological research and forecasting innovation. In 1979 the Prototype for Regional Observing and Forecasting Services (PROFS) was established within the NOAA Office of Oceanic and Atmospheric Research, signaling the beginning of GSL’s journey in Boulder, CO. The concept was to create a weather service system oriented toward user requirements. The system would foster information flow b between operations and research.
1980s: Expansion and Innovation
- 1981-1982: PROFS expanded its staff and capabilities, introducing a computer system for real-time weather data acquisition and conducting its first real-time forecast exercise.
- 1982 PROFS became the “Program” for Regional Observing and Forecasting Services.
- 1983-1984: Continued advancements with real-time forecast exercises and technology transfer initiatives, including the Profiler Technology Transfer group’s formation.
- 1985: Significant real-time summer forecasting exercise, with the Cheyenne flood highlighting PROFS’ forecasting impact.
- 1986: DAR3E project initiation, showcasing early versions of advanced forecasting workstations.
1990’s: Growth and Development
- 1990 FSL and partners began development of the Advanced Weather Interactive Processing System (AWIPS) forecast preparation system
- 1992: GSL developed the 40 km Rapid Update Cycle (RUC) model to support the aviation and environmental science community.
- 1994: RUC goes into official operations, a testament to FSL’s impactful research and development.
- 1997: GSL develops the Graphical Forecast Editor (GFE) that allows forecasters to create detailed graphical depictions of impending weather.
- 1998 The 40-km RUC was implemented into NOAA NWS operations.
2000s: Towards the Global Systems Division
- 2000 THE NOAA NWS commissioned AWIPS nationwide.
- 2002 The RUC increased in resolution to a 20km grid and was implemented into operations.
- 2004 The Meteorological Automated Data Ingest System collects data from almost 15,000 stations providing a valuable national mesonet for weather diagnosis and prediction.
- 2004 GFE becomes fully operational in NOAA NWS offices.
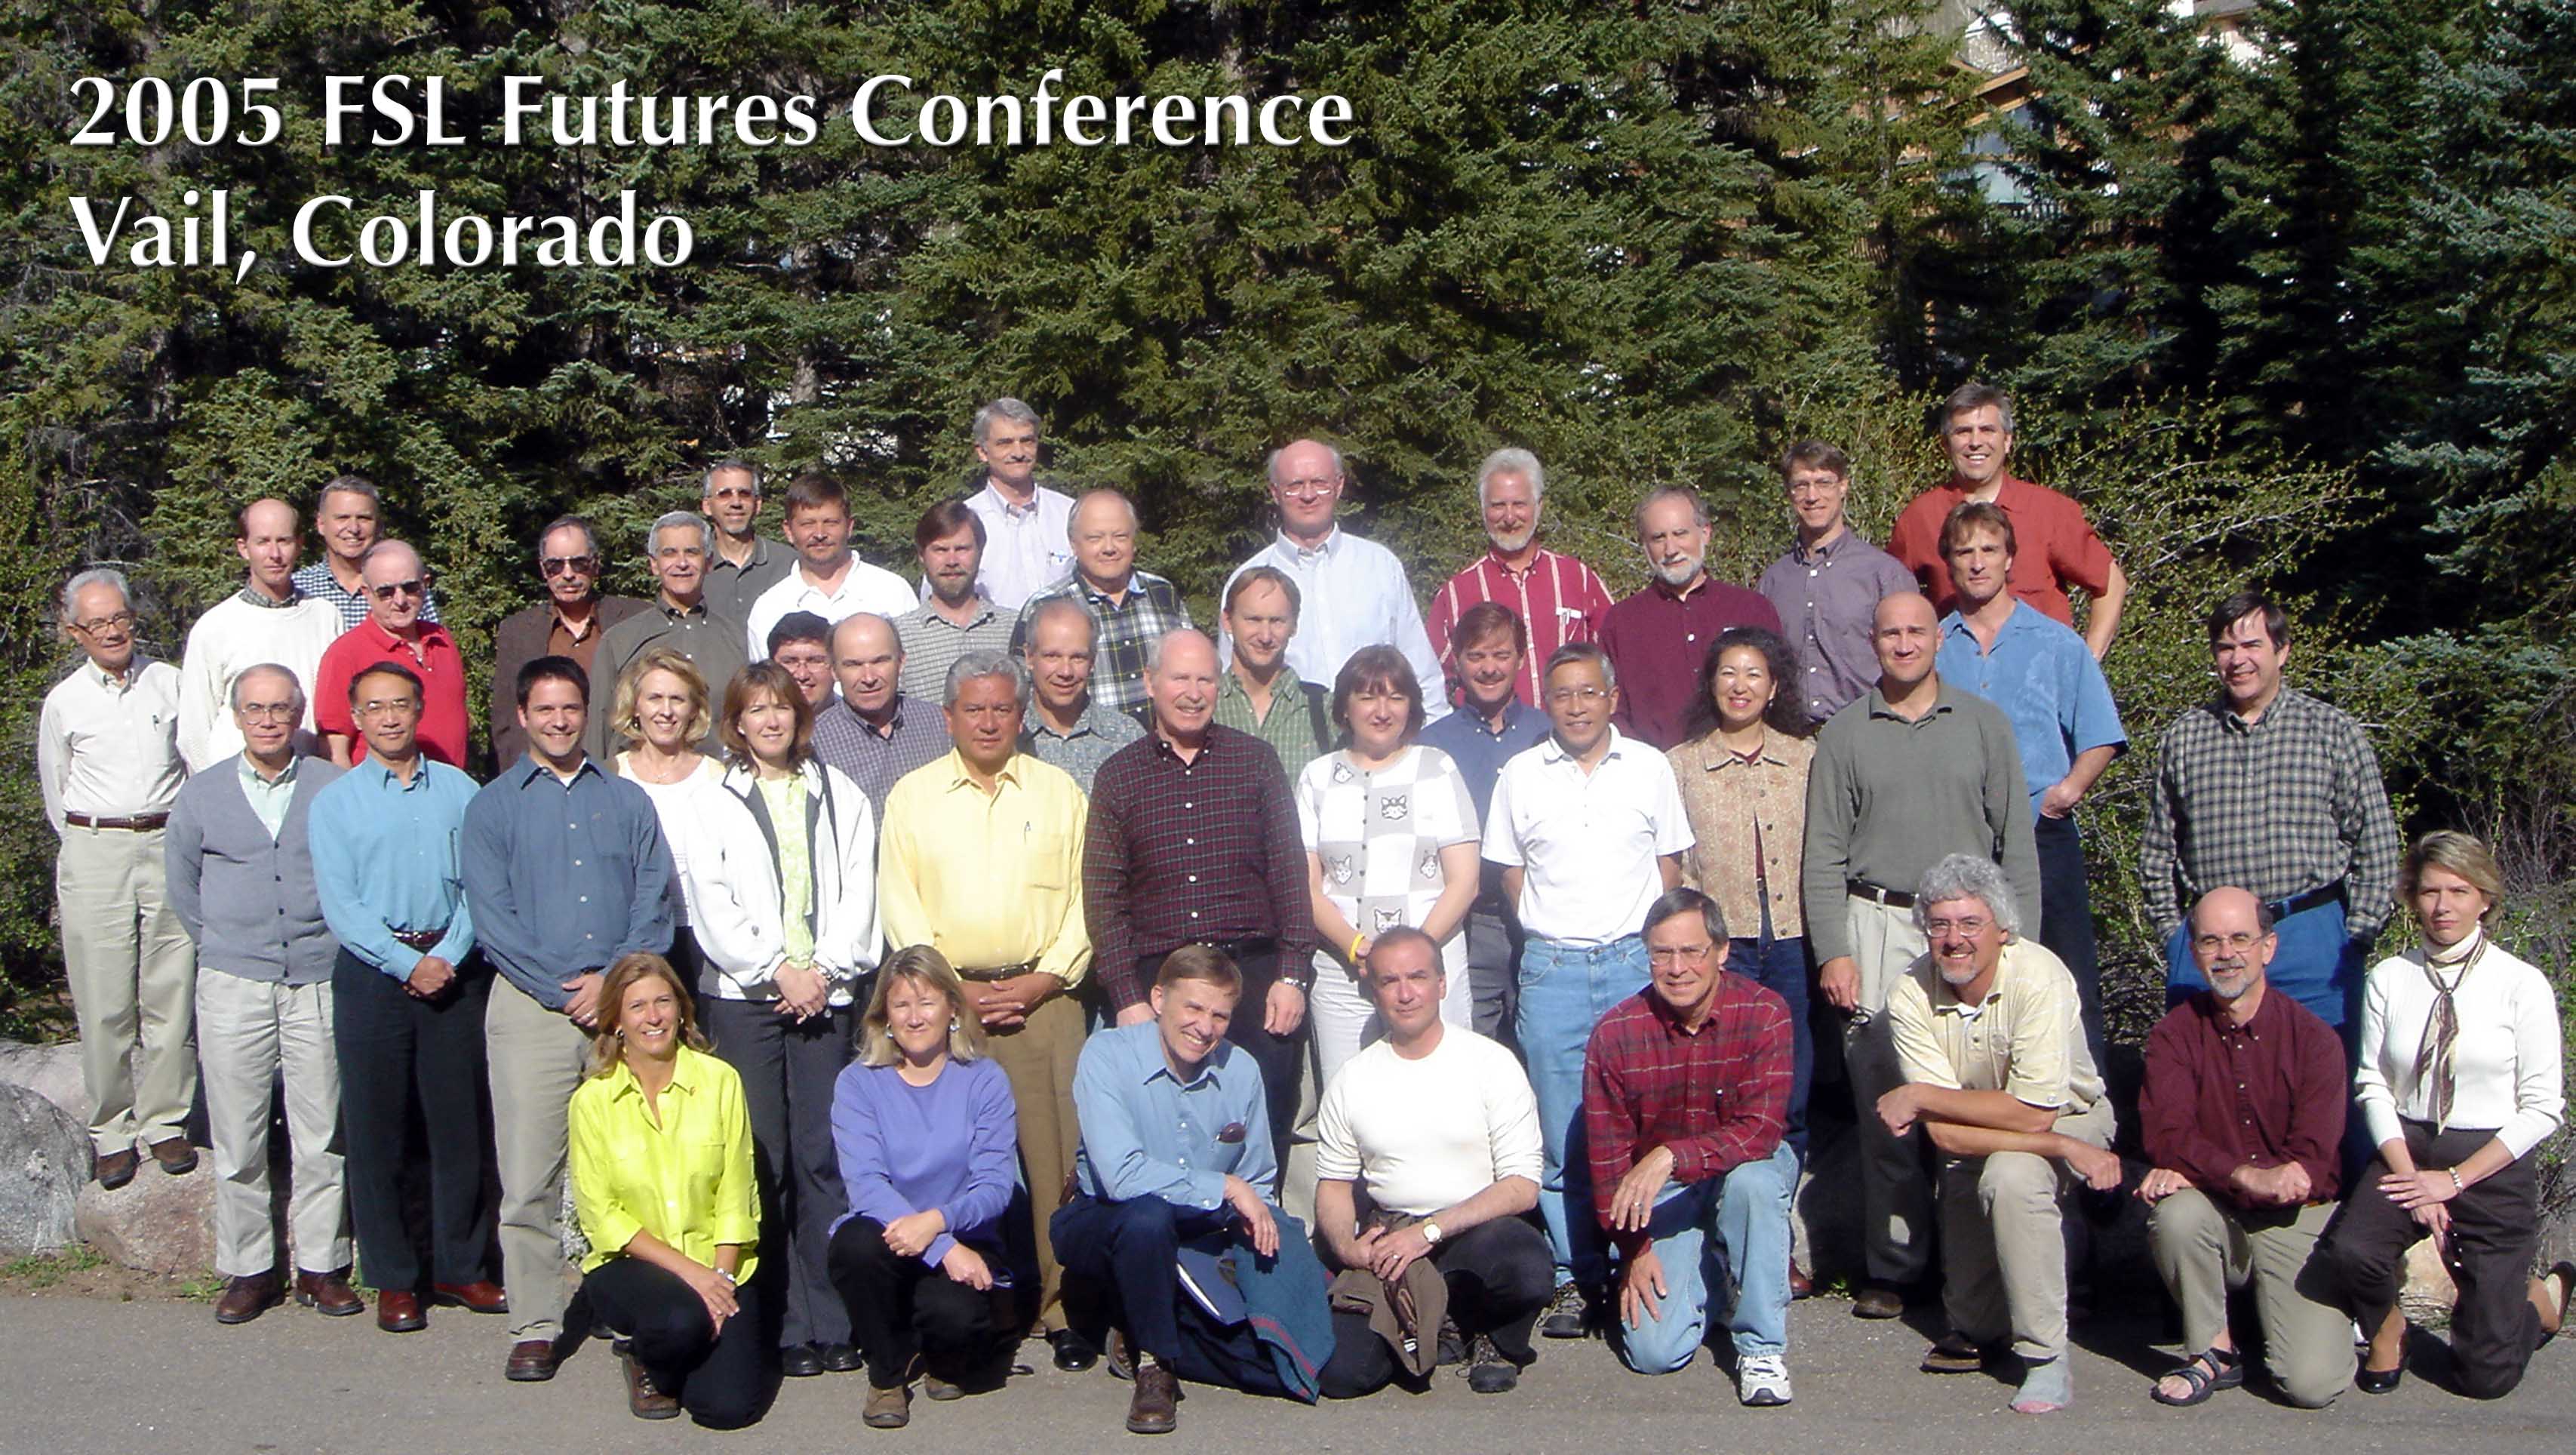
- 2005 FSL’s evolution into the Global Systems Division of the Earth System Research Laboratories was part of NOAA’s strategic reorganization to enhance research and forecasting capabilities.
- 2005 Science On a Sphere was invented by Dr. Sandy MacDonald and patented by NOAA.
- 2005 - The 13 km Rapid Update Cycle model was implemented into operations.
To be continued...