Official websites use .gov
A .gov website belongs to an official government
organization in the United States.
Secure .gov websites use HTTPS
A lock (
) or https:// means you’ve safely connected to
the .gov website. Share sensitive information only on official,
secure websites.
GSL delivers the prototype Advanced Quantitative Precipitation Information system to Bay Area users
.jpg)
Tracking raindrops from cloud to ground to river and ocean in the San Francisco Bay Area.
Heavy rain events are a hazard for California’s San Francisco Bay area and can overwhelm the water and wastewater infrastructure. The Advanced Quantitative Precipitation Information (AQPI) is a regional project awarded to NOAA and collaborating partners by the California Department of Water Resources to enhance public safety through early warning and storm tracking. The AQPI system consists of improved weather radar data for precipitation estimation and short-term nowcasting (0-1 hours); additional surface measurements of precipitation, streamflow, and soil moisture; and a suite of forecast modeling systems to improve lead time on rainfall and coastal Bay inundation from extreme storms–especially moisture-laden atmospheric rivers.
Leveraging GSL's research in high-resolution forecast modeling and weather information systems, GSL’s Information and Technology Services (ITS) Division was responsible for designing and developing AQPI. GSL has now transitioned the experimental AQPI system to prototype operations at Colorado State University’s Cooperative Institute for Research in the Atmosphere (CIRA). CIRA will maintain the prototype system over the next two years as they continue to build out the network of radars and enhance their algorithms for precipitation estimates and nowcast. CIRA is working with the Center for Western Weather and Water Extremes (CW3E) at Scripps Institute of Oceanography to locate a permanent home for the system. NOAA’s Physical Sciences Laboratory (PSL) will continue to deploy a state-of-the-art network of observations in the San Francisco Bay area to support AQPI over the next year.
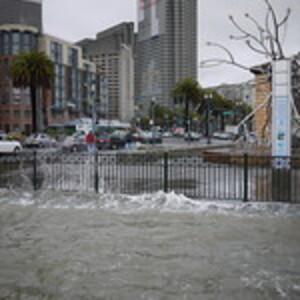
Thumbnail caption: San Francisco King Tide by Chris Martin. CC license.
Caption: Prototype AQPI interface for demonstration
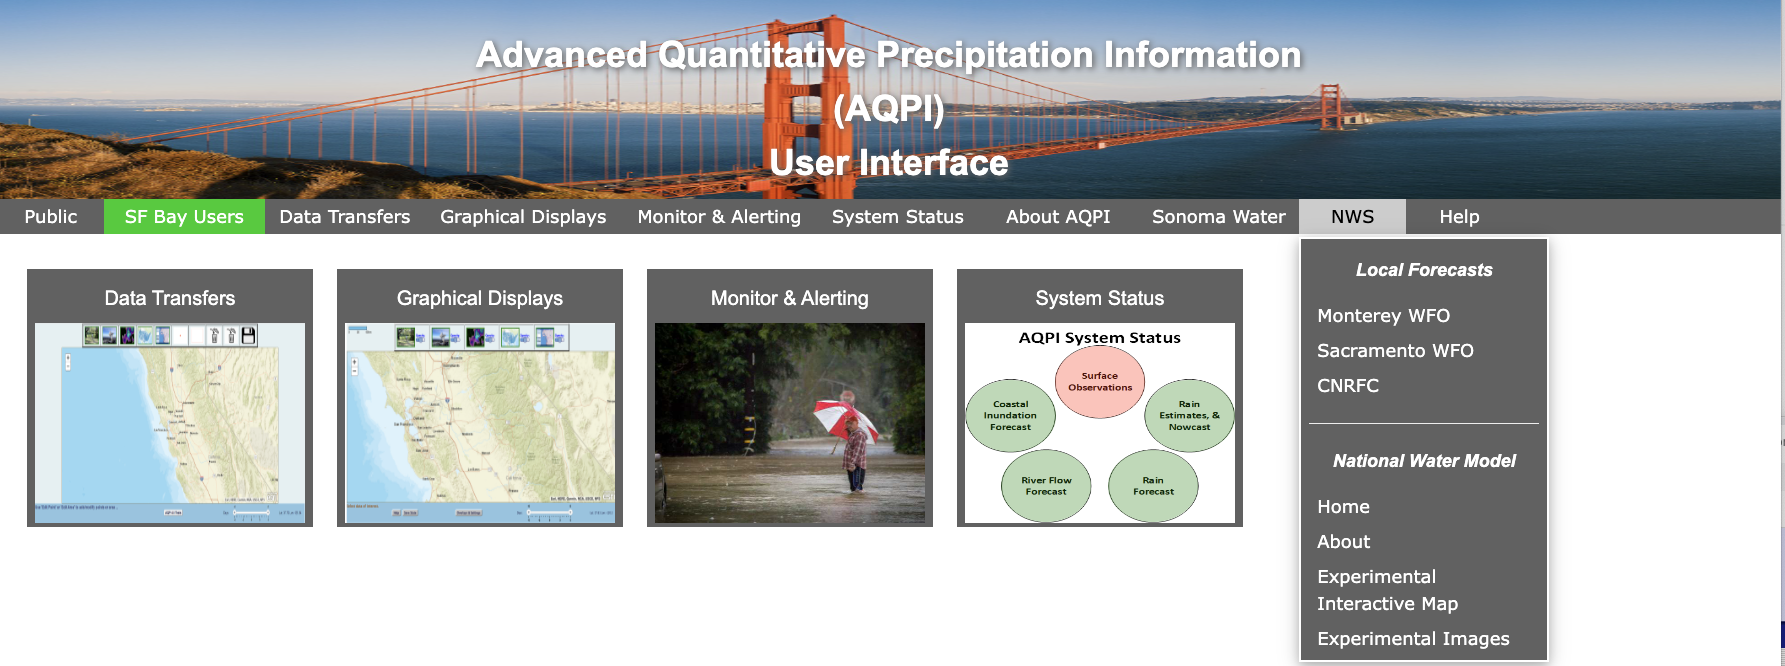
Caption: Prototype interface for San Francisco Bay Agencies. The interface was designed to provide atmospheric/hydrological data and forecasts in digital and graphical form to improve operational decisions, a monitoring and alerting system to warn when a rain event will be a problem based on their thresholds (underdevelopment), and an AQPI systems monitor that alerts when data and products aren't being created. The NWS drop-down provides access to the NWS official products for the Bay area (Atmospheric, River forecast, and water model forecasts).
AQPIDataProvisioning ---- This is the graphical interface labeled as "Data Transfers" on the AQPIUserInterface image. It was designed so that water agency users could select the data that they would like to download for use by their operational applications. The data selections (five images at top left of the screenshot) are made by selecting one to all of the images (the Green box around the image means it is selected). All five are selected, and they are from left to right Surface observations, Radar Observations, and Nowcast, Atmospheric forecasts, River Flow forecasts from the National Water Model, and Coastal Inundation forecasts from the USGS CoSMoS model.
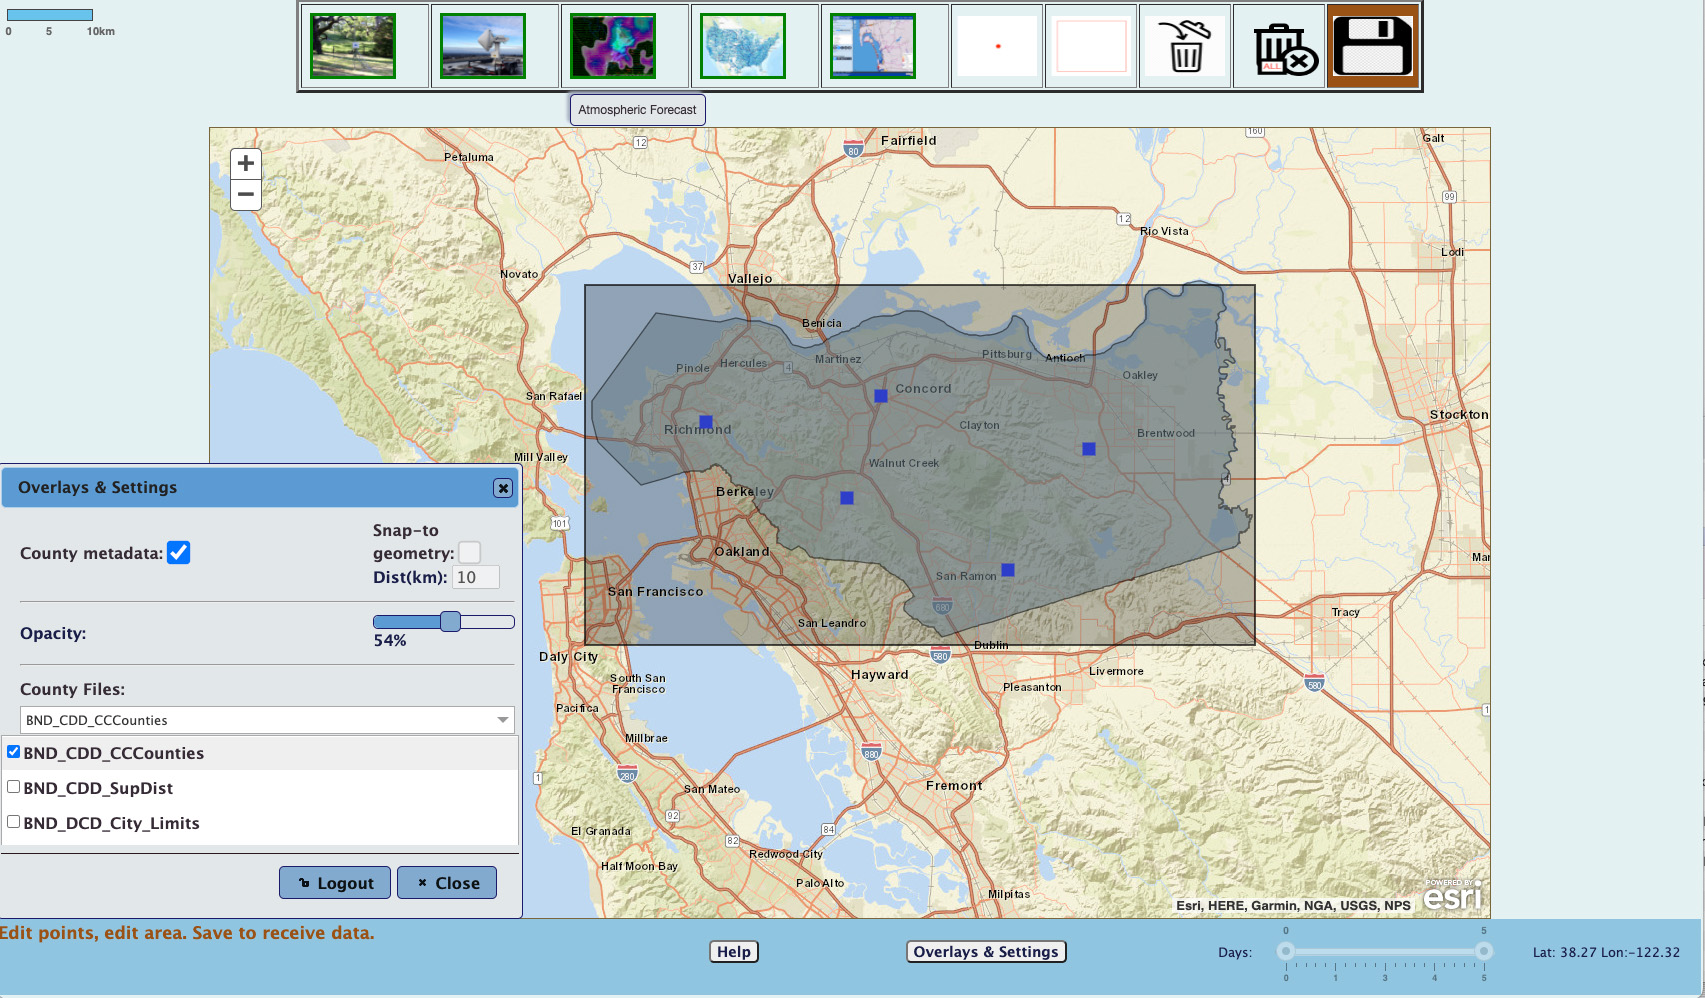
Caption for image below: The next two images provide the agency to select to provision point data or area data (grided). Water agencies GIS information is available from the overlays and settings menu (menu image bottom left). The display shows the Contra Costa County border, the area they would like data and forecasts in a gridded form, and the five points that they would like data and forecasts for. The trash cans are used to delete one or all points or areas and the brown floppy is for saving the user selections which includes zoom, GIS files to display, and current point and area information.
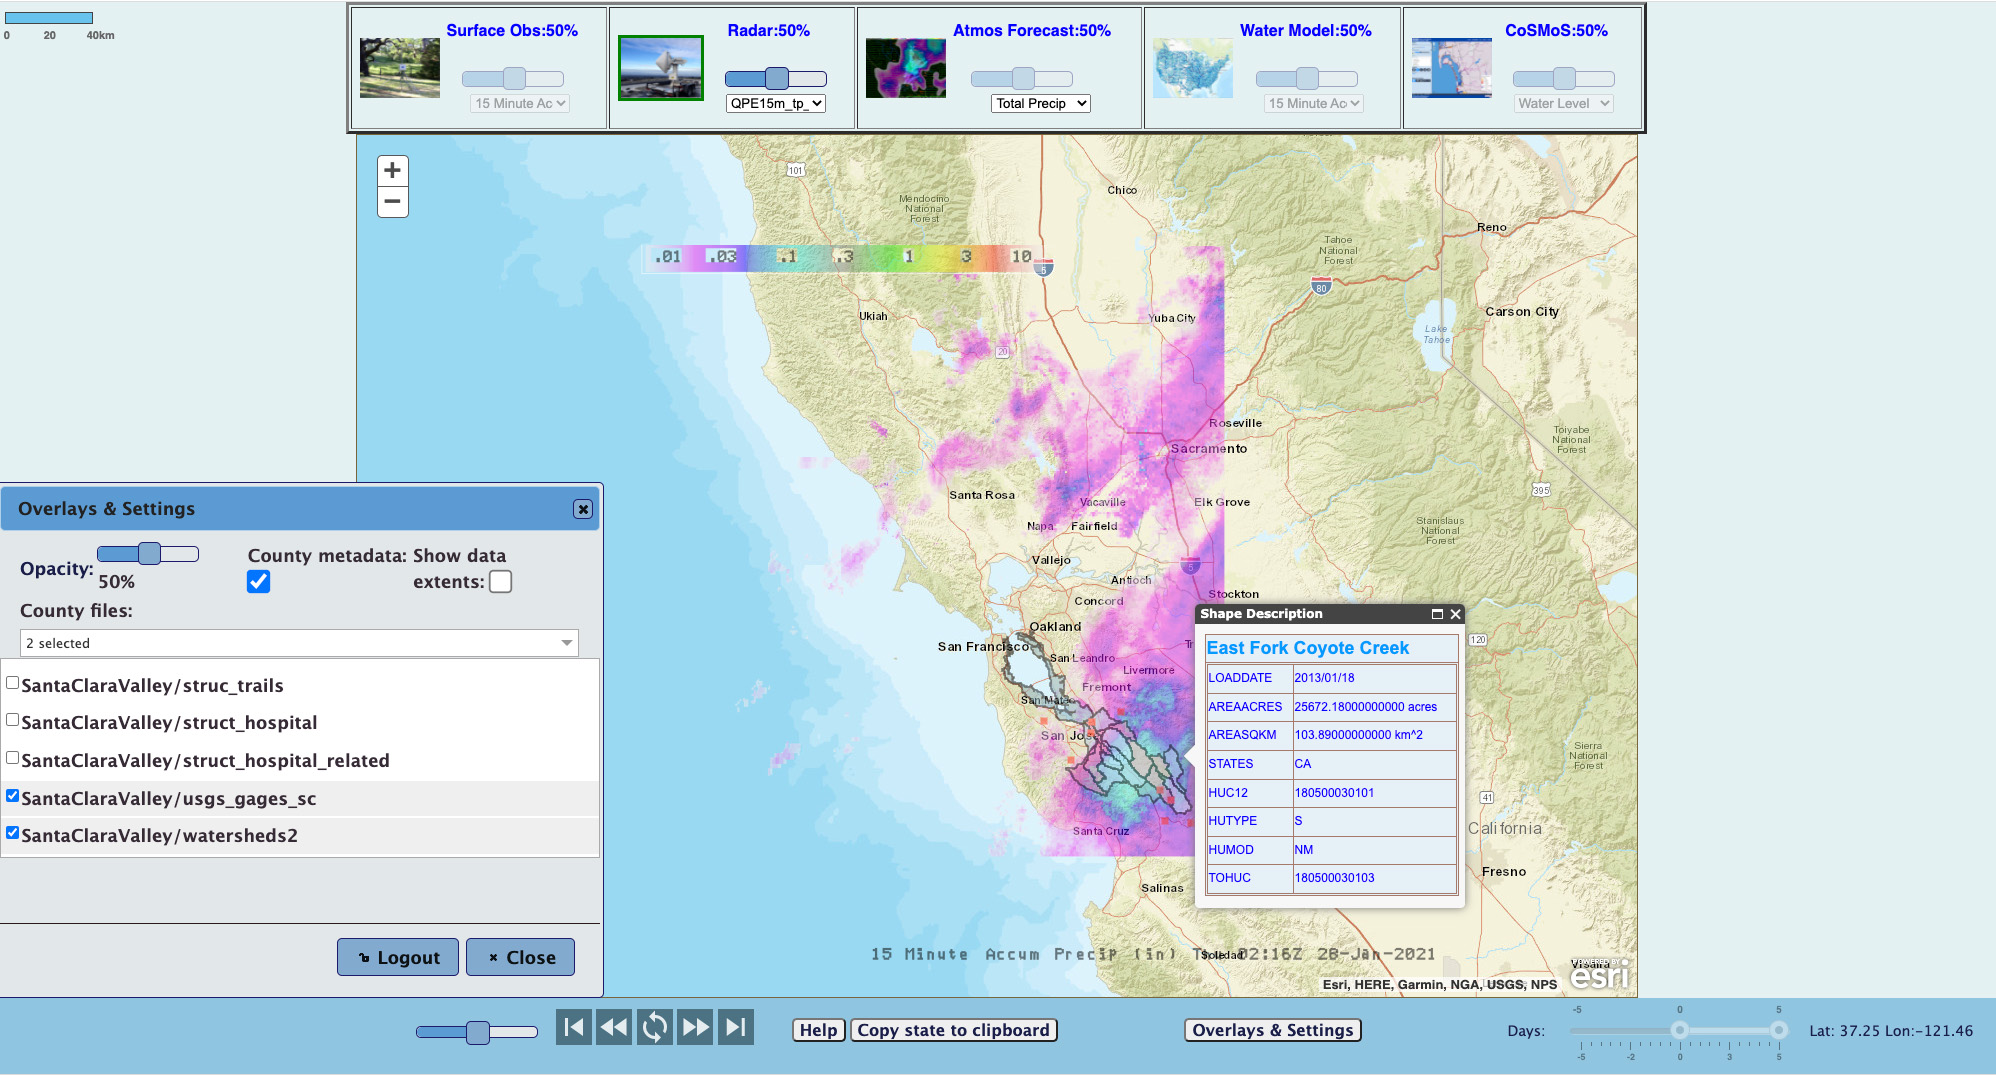
Caption for image below: AQPIGraphicalDisplay ---- The images at the top are for the type of information to display and provide access for displaying observations and forecasts using the dropdown menus and also allow the user to select transparency. The overlays and settings provide the users access to their GIS data and the ability to select the transparency and to provide metadata for the GIS when the mouse is moved over the GIS item. The users can loop or step through the images. They can control the loop speed, and they have the ability to zoom in. The current image is of 15-minute precipitation estimate derived from MRMS and the AQPI x-band radars.