
 )
)
DESI
Dynamic Ensemble-based Scenarios for Impact-based Decision Support
What DESI Does
A next-generation web application that helps NOAA forecasters explore, compare, and share ensemble weather guidance.
DESI lets National Weather Service offices and partners slice, dice, and visualize ensemble model output to support Impact-based Decision Support Services (IDSS). Forecasters can move from a broad-brush national view down to street-level details, compare model members, and create share-ready graphics in one workspace
Standout Features

Layer System
Stack fire perimeters, social-vulnerability grids, tribal boundaries, forecast zones, and more on top of ensemble guidance. Quickly visualize ensemble soundings at any point on the map, complete with statistics relevant to the vertical atmospheric profile.
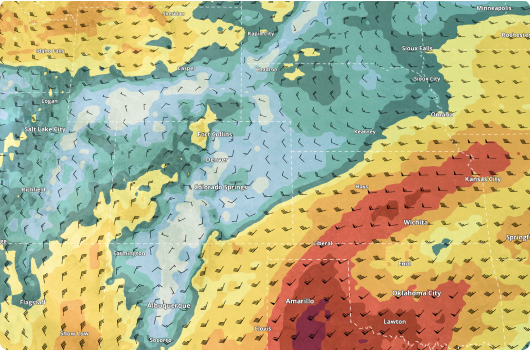
Dynamic Plan-view Maps
Say goodbye to static maps. DESI allows users to adjust the pan and zoom levels on the fly. Adaptive resolution maintains rapid loading of data, even at the CONUS scale.
Ensemble Clustering
Distill hundreds of ensemble members down to easily digestible weather “scenarios” to aid in the communication of possible outcomes.
Probabilistic Sounding Viewer
Quickly visualize ensemble soundings at any point on the map, complete with statistics relevant to the vertical atmospheric profile.
Weather Products
Generate images and short videos that highlight any displayed weather information for use in briefings or social media.
Model Status & Data Alerts
A live dashboard flags late data and pushes notifications the moment new ensemble runs land, so forecasters never brief on stale guidance.
Data at Your Fingertips
Ensembles
HREF, LREF, NBM (CONUS, Alaska, OCONUS) and more.
Visualizations
Statistics, model spread, timing, probability of expectance, joint probabilities, neighborhood probabilities, paintball plots and more.
Storage
Cloud-optimized Zarr stores with on-demand chunk loading keeps download sizes small while exposing full native resolution.
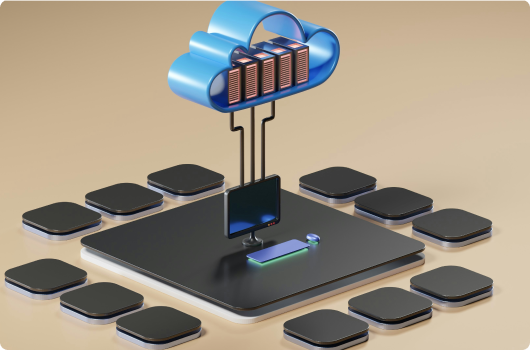
Cloud-Ready Architecture
DESI 3.x runs on Kubernetes. When many offices log in, extra servers spin up; when traffic drops, the surplus instances shut down, cutting compute costs.
Version 3.0 rebuilt the front-end memory handling, so complex 3-D scenes stay responsive on desktops, laptops, and even tablets - though tablets were never the primary design target.
Real World Impact
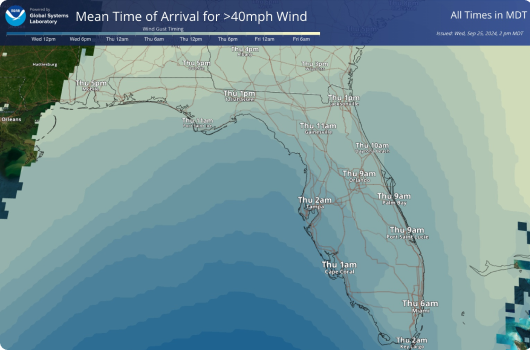
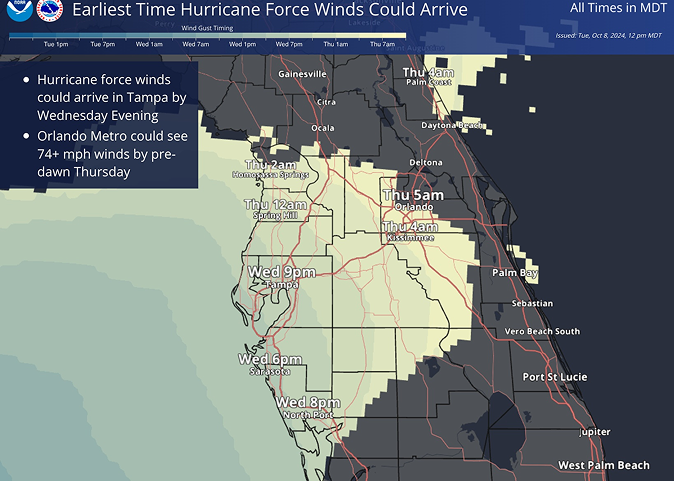
When Hurricanes Helene and Milton spun up during the 2024 Atlantic season, forecasters turned to DESI's ensemble timing displays to brief local, state, and federal partners. Hour-by-hour graphics showed when the earliest onset of specific wind thresholds would reach certain areas, giving partners critical information to aid their decision-making process. A post-season survey of 45 meteorologists reported that the updated timing graphic was clearer and easier to share during public briefings and partner calls.
Our Mission
Lead research and directed development through the transition of environmental data, models, products, tools, and services to support commerce, protect life and property, and promote a scientifically literate public.
Research Areas
Organizational Excellence, Earth System Prediction, Advanced Technologies, and Decision Support are the foundation to achieving the GSL Grand Challenge: Deliver actionable global storm-scale prediction and environmental information through advanced technologies to serve society.